Do You Need to Know Statistics in Digital Marketing?
How understanding statistical analysis can be the key to your marketing campaign and confidence
I Didn’t Think Statistical Analysis Was Important in Marketing (I Was Wrong)
Do you need statistics for marketing? If you’d asked me this a few years ago, I would’ve said no. Statistics felt like something for researchers or academics — not marketers like me. But once I started using it, it completely changed how I approach my data.
I didn’t always see the value of stats. In fact, I used to focus just on the surface numbers — click-through rates, bounce rates, revenue — but I wasn’t looking deeper. When I finally did, I realised statistics wasn’t just for data scientists. There were tools I could use every day to make better marketing decisions.
And here’s the truth: you don’t have to be a math genius to use statistics in digital marketing. You just need to know the basics.
Why Statistics Should Matter to Marketers
Marketing today is packed with data. Campaigns generate clicks, impressions, conversions, and much more. Every article you read tells you that you need to be “data-driven,” but how do you move beyond just reporting number? The answer lies in statistics.
With a solid grasp of a few key concepts, you’ll gain a deeper understanding of your data, improve campaign outcomes, and even predict future trends.
Here’s why statistics can be a powerful tool in your marketing strategy.
1. Helps You See the Bigger Picture
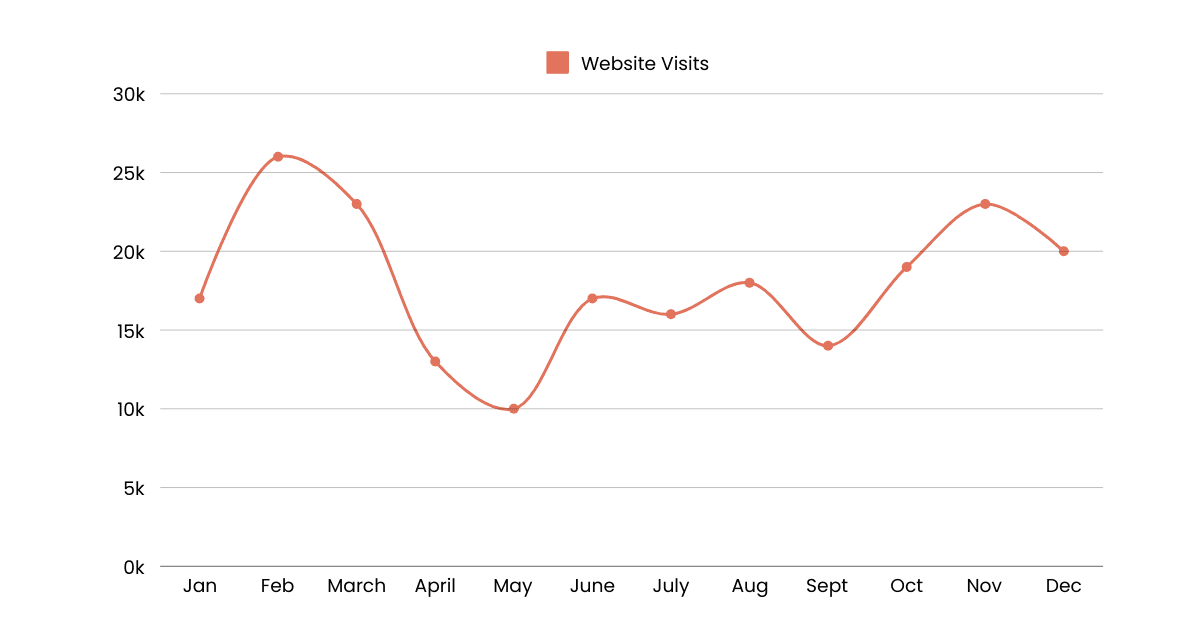
Marketing data is like a puzzle. You can see individual numbers — like a 20% email open rate or 15,000 website visitors last month — but how do they fit together and what’s the larger story? Statistics simplifies things by pulling out patterns and trends that aren’t obvious at first glance.
Statistics allows you to:
- Identify trends: Spot seasonal patterns or long-term growth. Is your website traffic truly growing, or is it just a seasonal blip?
- Compare results: Determine if changes in performance are meaningful or just random fluctuations. Are your recent campaign improvements meaningful or just random?
- Summarise complexity: Use measures like averages or medians to make sense of large datasets.
Let’s say you notice a 5% drop in your website traffic. Is it something to worry about? Using statistical techniques, you can compare this decline to past data and decide if it’s part of a larger trend or a one-time anomaly. is it a cause for concern?

2. Make Decisions with Confidence
Have you ever looked at your campaign results and wondered, Is this result real? Did that bump in sales happen because of your new ad or just because it’s Black Friday?
With tools like confidence intervals or p-values, you can make decisions based on data, not intuition. These measurements will tell you if your campaign results are solid enough to act on, and whether a campaign truly performed better or worse than expected
Example: A/B Testing
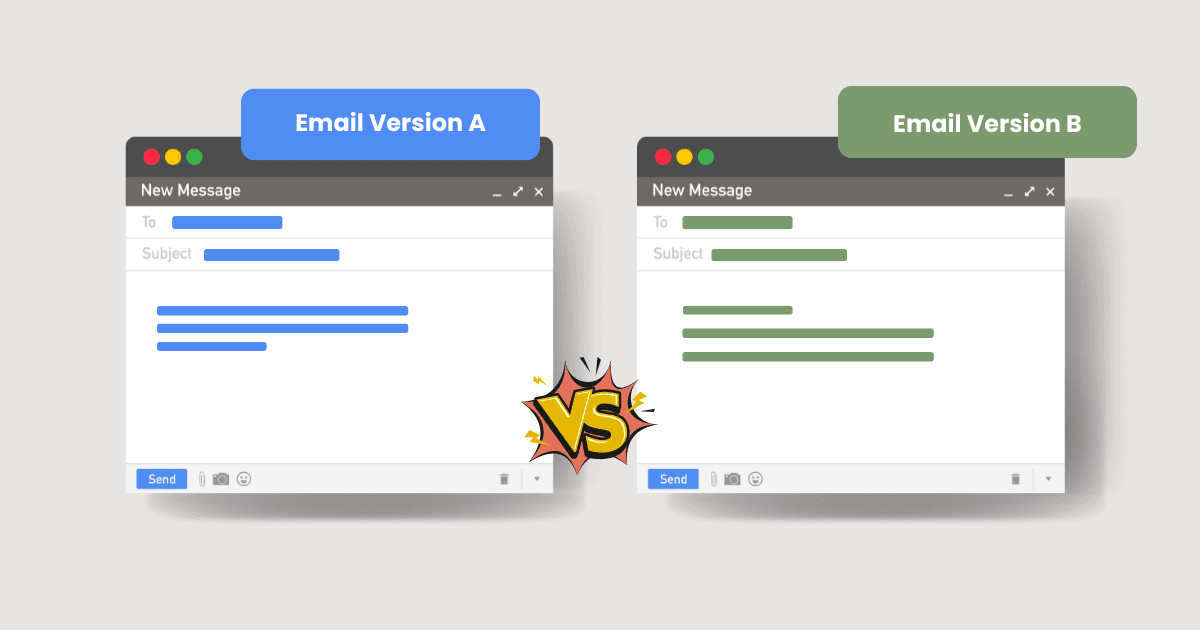
Let’s say you’re running an A/B test to determine which email copy performs better. The results show that Email A has a 7% click-through rate, while Email B has 6%. Is that 1% difference enough to declare a winner?
With statistics, you can measure if the difference is statistically significant or due to random chance. This can be done through online tools like VWO A/B Test Statistical Significance Calculator
- Statistically significant means the likelihood of an error is low enough that we can confidently say there’s a difference between the group compared.

3. Uncover Opportunities
Statistics doesn’t just confirm what you already know — it helps you discover what you don’t know. By analysing relationships between variables (like customer demographics and purchasing behaviour), you can:
- Segment your audience: Group customers into categories based on their preferences or spending habits.
- Predict future outcomes: Use regression analysis or other models to anticipate customer actions or forecast sales.
- Identify outliers: Spot unusual data points that could signal errors or opportunities.
If you’re analysing customer lifetime value (CLV), you might realise that a 20% of your customers generate 80% of your revenue. With this insight, you can tailor campaigns to nurture those high-value customers.
4. Stay Agile and Adapt to Changes
Statistics equips you with tools to evaluate changes in real-time and pivot your strategies accordingly.
During the rollout of a new campaign, you might notice a sudden spike in website bounce rates. Stats can help you determine whether this spike is tied to the campaign itself or external factors, like a new competitor or a seasonal trend.

Email Marketer by H from Prosymbols
It’s Simpler Than You Think
If the word “statistics” makes you think of complex formulas and dense textbooks, don’t worry. Modern tools like Google Sheets, Excel, or even visual platforms like Tableau make applying statistics simple and accessible.
You don’t need to memorise formulas — just need to know what questions to ask and where to look for answers.
Here are a few easy ways to start:
- Summarise your data: Use averages, ranges, or medians to simplify large datasets.
- Visualise trends: Create graphs or histograms to see patterns clearly.
- Run simple tests: Start with tools like A/B testing to validate your campaigns.
At its core, statistics is about clarity and confidence. It helps you make better decisions, optimise campaigns, and understand your audience. With a little practice and the right mindset, you can use statistics to inform the way you work.
If you’re ready to dive deeper into the practical side of stats, check out my guide to A/B testing.
