A Beginner’s Guide to A/B Testing in Digital Marketing
Learn to structure, run, and analyse A/B tests for marketing success. Use Google Sheets and simple tools to optimise your campaigns with confidence.
What is A/B Testing, and Why Does It Matter?
A/B testing is a method of comparing two versions of something (like a webpage or ad) to see which one performs better. Instead of trusting intuition, you let your audience tell you what works best.
For example:
- Should your call-to-action button be blue or orange?
- Does a shorter headline perform better than a longer one?
- Which email subject line gets more clicks?
A/B testing is simple in theory:
- Create two versions: Version A (the control) and Version B (the variation).
- Split your audience randomly between the two versions.
- Measure which version gets better results.
How Does A/B Testing Work?

Here’s how A/B testing works in five steps:
- Start with a hypothesis: Decide what you want to test and why.
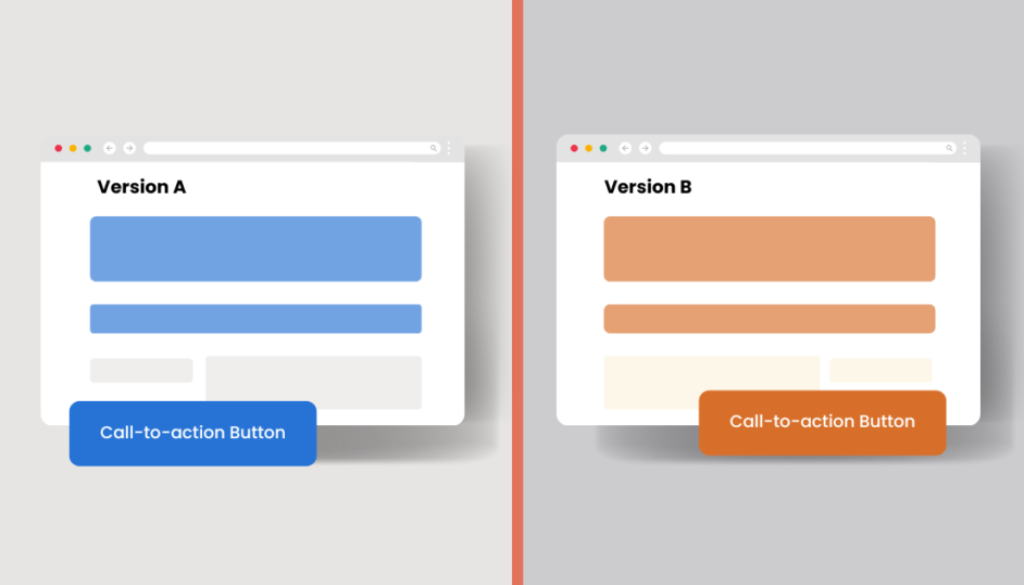
Example: “I think a blue call-to-action button will get more clicks than an orange one.” - Create two versions: Version A is your control (the original), and Version B is your variation (with a change).
Example: Your webpage with the blue button is A, and the one with the orange button is B. - Split your audience: Randomly divide your audience into two groups. One group sees Version A, and the other sees Version B. This step is important — if your groups aren’t random, your results could be biased.*
- Measure the results: Compare performance using metrics that align with your goals, like click-through rate (CTR) or conversion rate.
- Analyse the data.
Use statistical methods to confirm whether the difference between A and B is meaningful or just due to chance.
*Randomisation and Bias
When splitting your audience, you must randomise the samples to eliminate bias. Bias occurs when your sample doesn’t represent your audience accurately, skewing your results. Randomisation ensures every individual in your audience has an equal chance of being in either group, making your test fair and reliable.
(For more on this, check out my upcoming article on randomisation and avoiding bias in marketing tests.)
The Role of Statistics in A/B Testing
Here’s where it gets exciting (and slightly nerdy): A/B testing doesn’t just measure the differences; it proves that those differences mean something.
Statistics helps you answer:
- Is the difference between A and B significant or just random chance?
- How confident can I be in the results?
To interpret your results, you’ll rely on two key concepts:
- Statistical significance: This tells you whether the difference is likely real or just noise.
- Confidence level: This measures how sure you are about your results.
How to Conduct an A/B Test
Step 1: Choose What to Test
Focus on one variable at a time to avoid confusion. This also keeps your results clear.
Examples of testable elements:
- Email subject lines
- Call-to-action buttons
- Landing page headlines
- Ad creative (images, copy, or layout)
Step 2: Define Your Metrics
Decide how you’ll measure success. Your metric should align with your campaign goals.
Examples of metrics:
- Click-through rate (CTR) for emails or ads.
- Conversion rate for landing pages.
- Engagement rate for social media posts.
Step 3: Set Up the Test
- Use tools like Google Optimise, Optimisely, or your email marketing platform’s A/B testing feature to split your audience automatically.
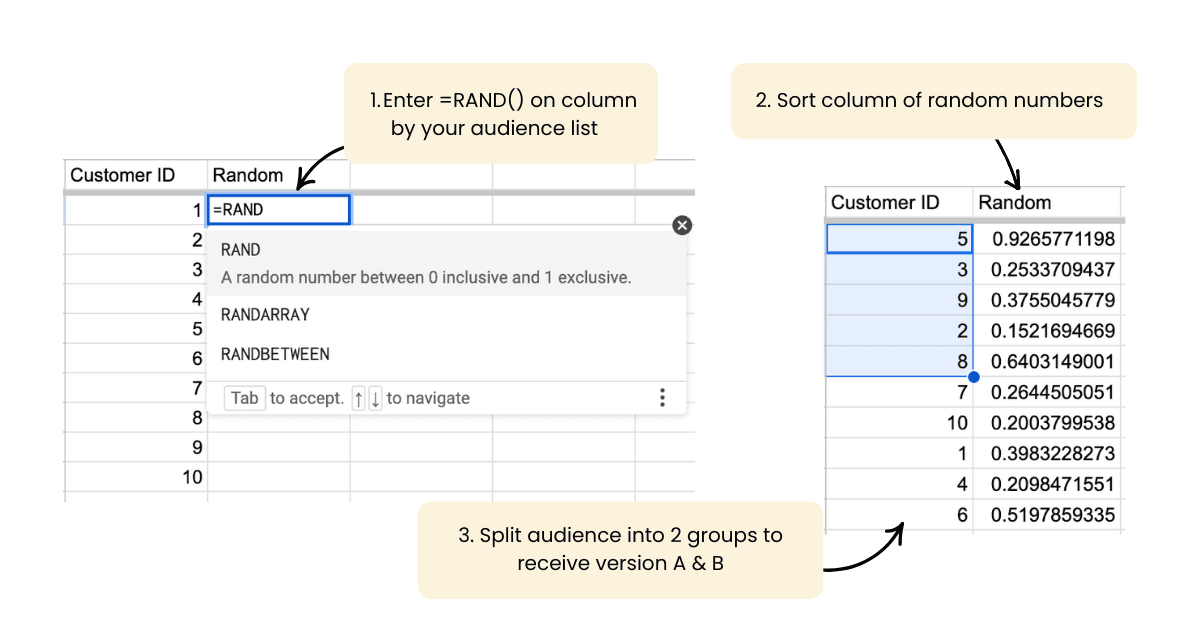
- If you’re running a manual test, ensure randomisation by using tools like Google Sheets to shuffle your audience. (Instructions below)

Shuffling Your Audience in Google Sheets
If you’re running an A/B test manually, you need to randomise (shuffle) your audience to eliminate bias. Here’s how to do it:
- Create your audience list:
Have a column with the names or IDs of your audience members. - Add a random number column:
Next to your audience list, use the=RAND()function to generate a random number for each row.
Example: If your audience is in column A, insert=RAND()in column B. - Sort by the random numbers:
Highlight both columns, then go to Data → Sort range. Sort by the column with the random numbers. This shuffles your audience. - Split into groups:
Divide your audience into two groups (e.g., top 50% for Version A, bottom 50% for Version B).
(This ensures every individual has an equal chance of being in either group, reducing the risk of bias.)
Step 4: Run the Test
Let the test run for a sufficient amount of time to gather meaningful data. Ending it too early might not give reliable results.
Interpreting Your Results
Once your test is complete, compare the performance of A and B. You’ll need to calculate:
- Conversion rates for each group.
- Statistical significance to determine if the difference is meaningful.
Using an Online A/B Testing Calculator
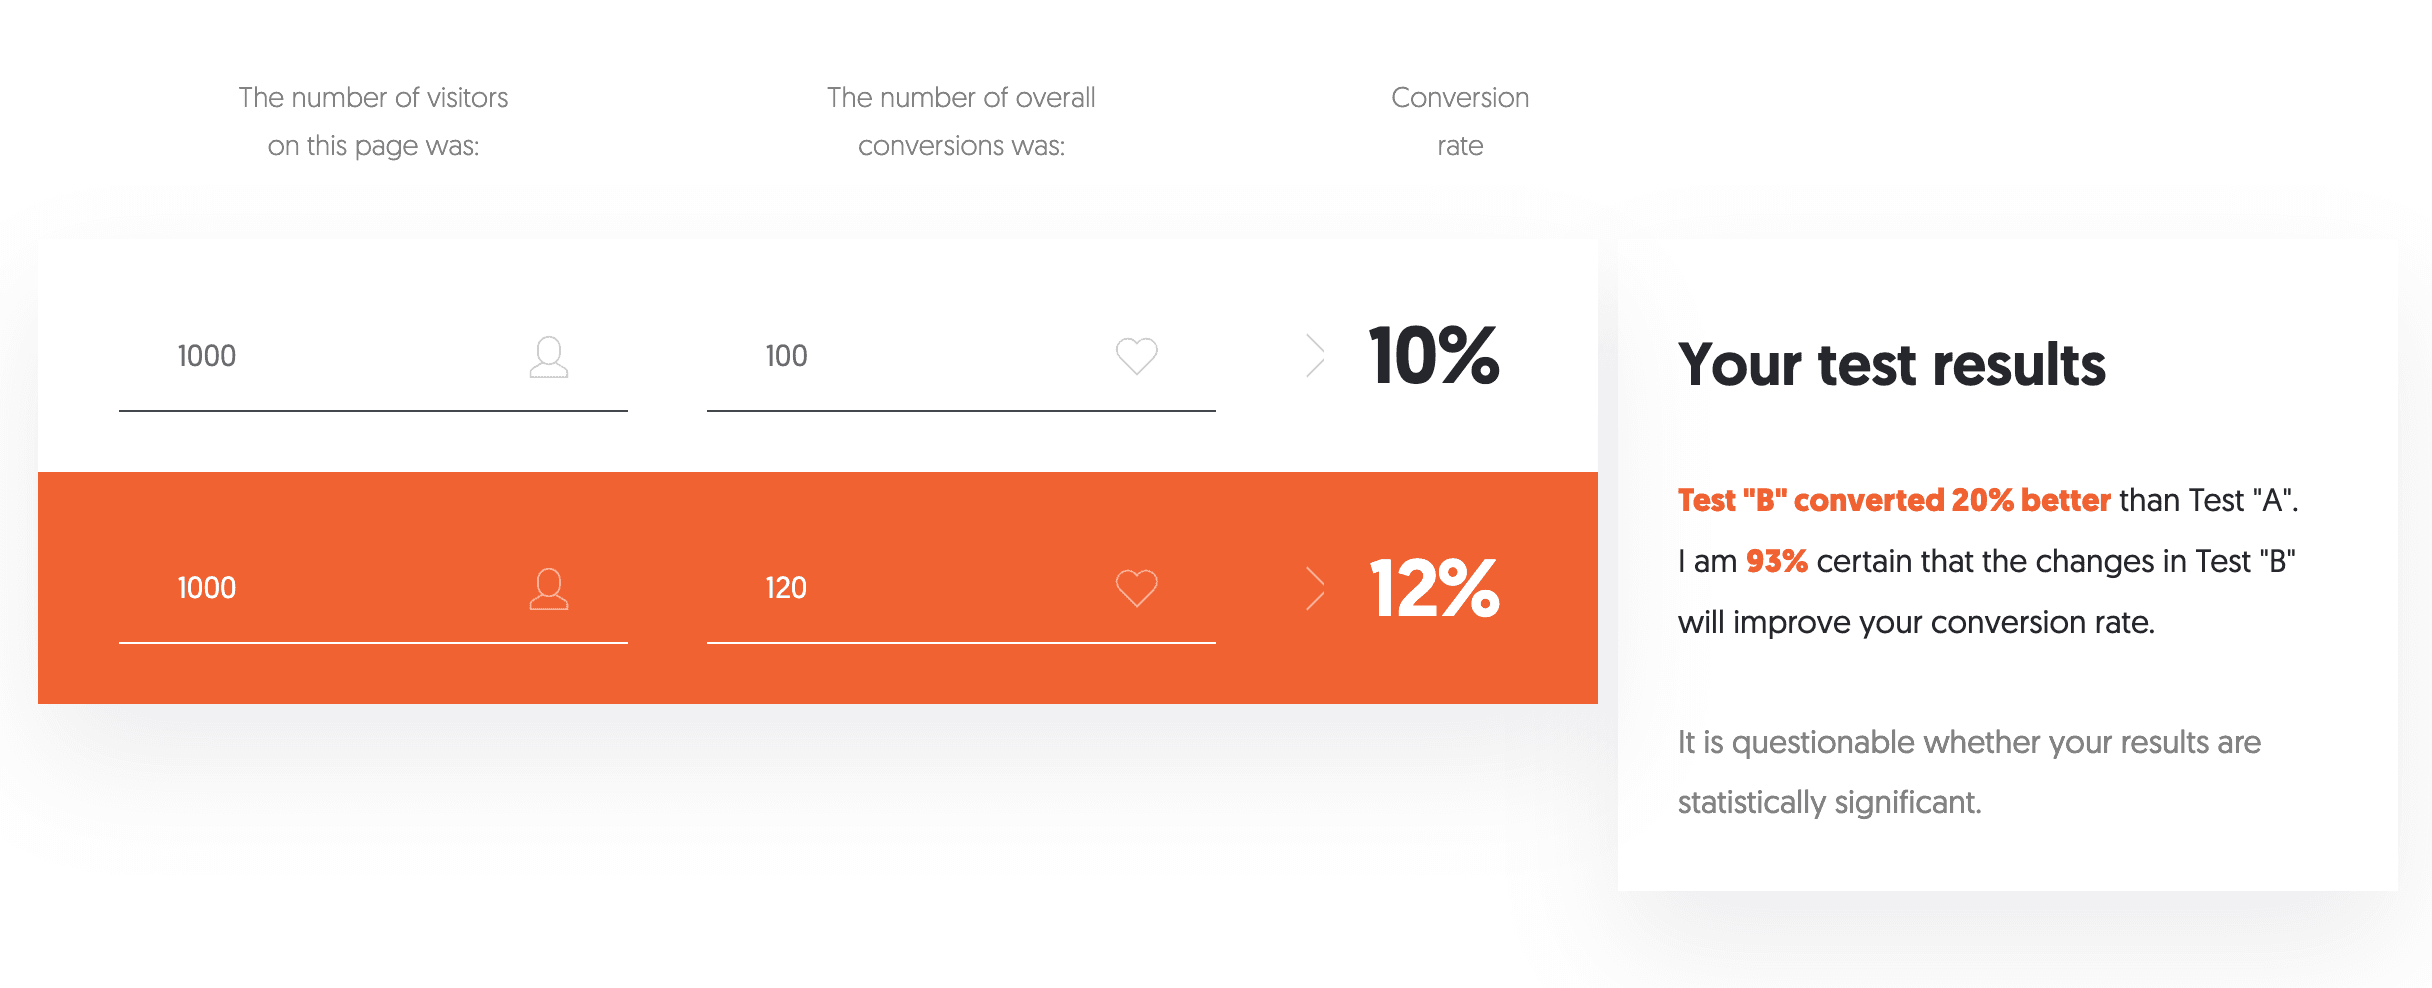
Online calculators like Neil Patel’s A/B Testing Calculator make analysing your results straightforward. Here’s how to use one:
- Control (A): Input the total number of visitors and the number of conversions for Version A.
- Variation (B): Input the total number of visitors and the number of conversions for Version B.

The calculator will tell you:
- Whether the difference is statistically significant.
- The confidence level of your results.
(Confidence levels above 95% are ideal, meaning there’s less than a 5% chance your results happened by luck.)
Common A/B Testing Mistakes
- Testing too many variables at once
Keep it simple with one change at a time. - Ending the test too soon
Wait until you have enough data to make a reliable conclusion. - Ignoring statistical significance
Just because one version looks better doesn’t mean it is.
Why A/B Testing is a Must-Have in Your Marketing Toolbox
A/B testing helps you:
- Make informed decisions
Being sure you know what works from your campaigns. - Understand your audience better
Learn what resonates most. - Optimise for better results
Constantly improve performance with each test.
A/B testing is scalable. Whether you’re testing email subject lines or many ad campaigns, the same principles apply. Start small, like testing an email subject line, and as you grow more confident, take on bigger challenges like landing pages or full ad campaigns. You’ll be interpreting and presenting results with confidence in no time!
