The Challenge Of Measuring Customer Spend in SaaS Marketing
Is average customer spend in SaaS accurate? Find out why it might not be, and learn alternative ways to measure customer spend for better marketing insights.
The Problem with Averages in Customer Spend Data
In marketing analytics, customer spend data tells you a lot about buying behaviour.
However, measuring and interpreting customer spend can be tricky—especially in SaaS models with tiered pricing. With subscription plans that range from low-cost monthly options to high-value annual contracts, calculating a reliable “average” spend per customer often leads to misleading results.
So why is measuring average spend so challenging in SaaS?
The primary issue lies in the wide disparity between the spending of different customer tiers. High-value customers with large, custom pricing contracts can skew the average, making it appear as if the typical customer is spending far more than they actually are.
Case Study: Tallys Marketing Company
Let’s break this down with a real-world example. Imagine a fictional SaaS company called Tallys Marketing, which offers four distinct pricing tiers. This case study helps illustrate the problem
Copy the dataset here to view the numbers. (This is fake data I created using ChatGPT).
I’ve tried to make the enterprise pricing vary so that it feels ‘customised’. I know this example might be a bit exaggerated, but these tiers reflect typical subscription-based models where spending can differ.
Tallys Marketing Company offers four pricing tiers:
- Basic: £15/month
- Pro: £50/month
- Advanced: £200/month
- Enterprise: Custom pricing between £1,000 and £3,000/month
The dataset has 300 customers, distributed across these tiers. You can already imagine that calculating a single “average” spend might not capture what a typical customer spends. The high-value enterprise customers will inflate the number, masking the spending behavior of most customers, who are on lower-priced plans.
The Mean: Why It’s Often Misleading
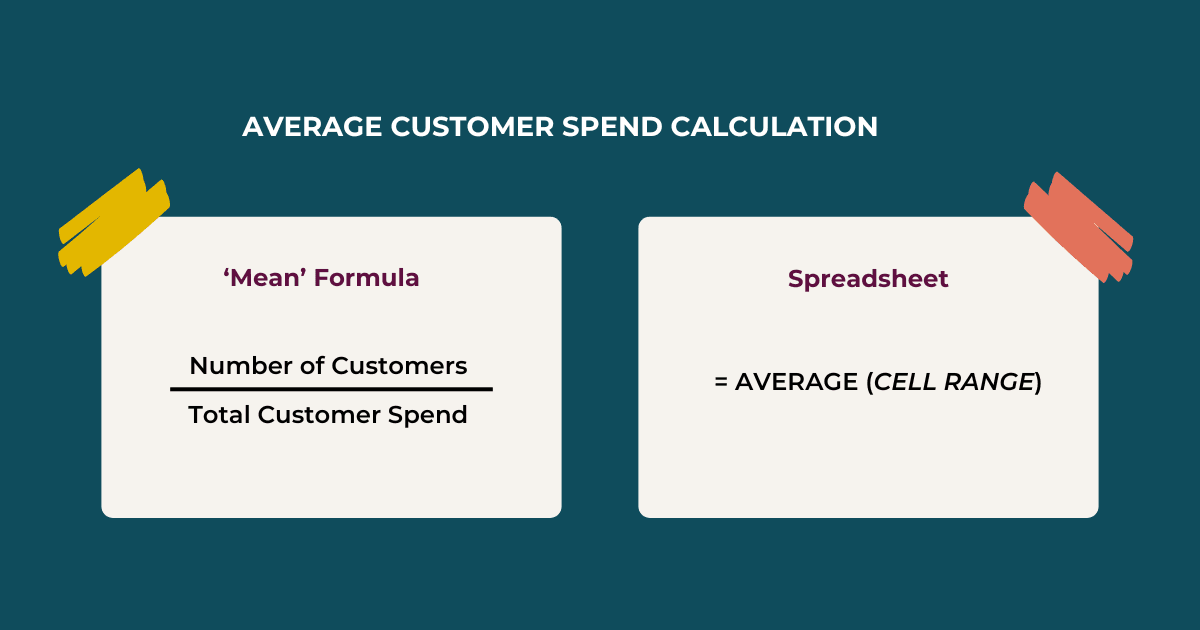
The mean (or simple average) is calculated by adding all customer spend values and dividing by the number of customers.
Here’s an example for Tallys:
- Number of customers: 300
- Mean Yearly Spend: £1,309.90 per customer

At first glance, this might seem to suggest that the average customer spends around £1,300 per year. However, this number is heavily influenced by the high-spending Enterprise customers. In fact, many Basic and Pro clients are spending significantly less.
Why the Mean Isn’t Enough: Alternative Metrics to Consider
If your data includes extremes (outliers), like high-spending clients, the mean can distort the true “average.” This makes the mean less reliable. For marketers, this can be misleading when you’re trying to design targeted campaigns.
To get a more accurate understanding of typical customer purchases, we need to look at other metrics. The mode and the median provide better results.
Mode: The Most Frequent Spend
The mode is the value that appears most frequently in a dataset. For Tallys, the mode yearly spend is £182.28 corresponding to the Basic tier. This indicates that the largest proportion of customers fall into the Basic tier, which is helpful when you want to focus on the most common customer group.
Median: A Better Reflection of “Typical” Spend
The median is the middle value when data is sorted from lowest to highest. It’s not influenced by outliers, making it a more reliable metric in skewed datasets.
For Tallys:
- Median Yearly Spend: £185.35
This median gives a more realistic picture. Half of Tallys’ customers are spending more than £185 per year, and half are spending less.
Visualising the Data: What a Histogram Reveals
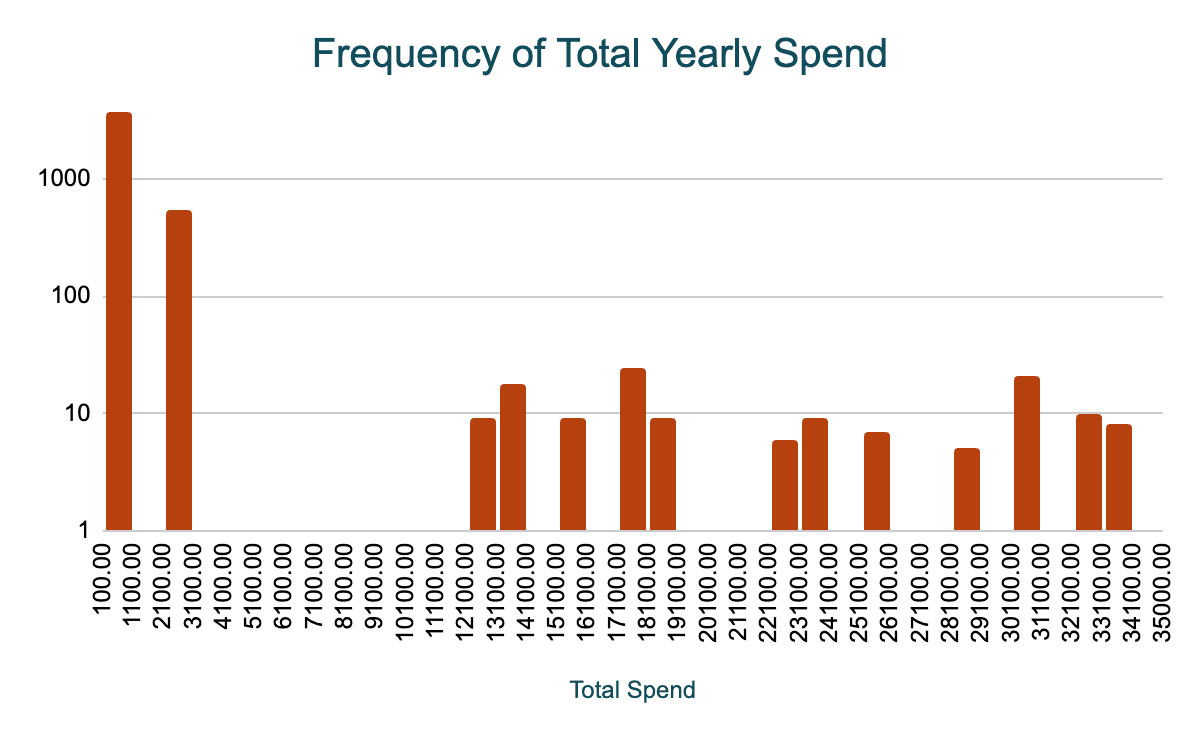
To better understand the distribution of customer yearly spend, let’s visualise the data with a histogram. This chart helps show where customers cluster.

As expected, we see a clear right-skew — a large concentration of low-spending customers on the left, and a smaller group of high-spending Enterprise clients. This visual confirmation highlights why the mean doesn’t accurately reflect the typical customer for Tally Marketing Company.
More Accurate Ways to Measure Customer Spend in SaaS
Here are three alternative methods for measuring customer spend:
1. Segment by Customer Tiers
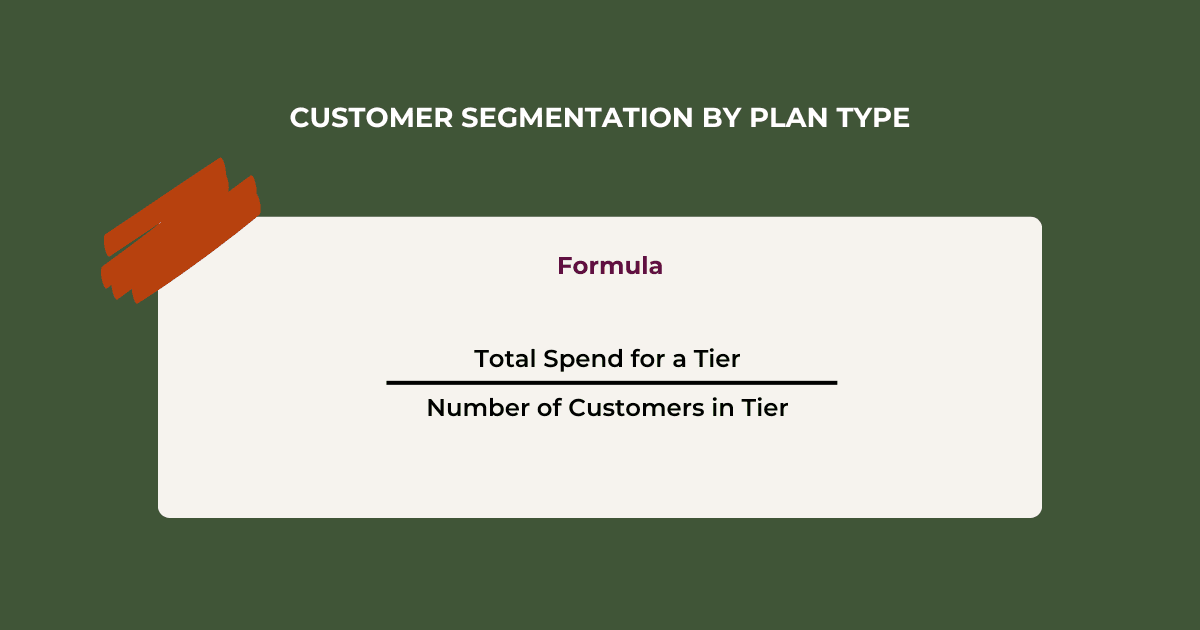
Instead of calculating a single average for all customers, segmenting by plan allows for more meaningful insights. By calculating the median spend for each tier, you get a clear picture of the spending behaviour within each group.
The fixed plans are consistent so they’ll always have the same median.
For Tallys Marketing:
- Basic: £182/year
- Pro: £599/year
- Advanced: £2383/year
- Enterprise: £22,938/year (customised)

Benefits:
- Tailored Strategies: Segmenting lets you build specific strategies for each customer group, like focusing retention on Advanced and Enterprise clients, or targeting Basic tier customers for upsells.
- Year-on-Year Comparison: Segmenting makes it easier and clearer for track performance and pricing balance over time.
2. Percentiles in Spend
Percentiles divide your data into segments, showing how spending is distributed across customers. For example, the 50th percentile (or median) represents the typical customer, while the 90th percentile shows the top 10% of spenders.
We’ll exclude the 25th percentile because it represent these the lower quartile of spenders (low-value customers)
- 50th Percentile (Median): £185.35/year
- 90th Percentile: £2373.26/year (top 10% spend at least this much)
Benefits:
- High-value customers: The median represents the typical customer so you can focus on acquiring more customer similar to this average.
3. Customer Lifetime Value (CLV)
For a SaaS subscription model, sometimes it’s better to focus on a long-term view of customer profitability. CLV accounts for how much a customer will spend over the entire lifespan. It also gives you insights to acquisition costs. There are many ways to calculate CLV, but we’ll do a simple version, taking in account the frequency of purchases.
Benefits:
- Guides acquisition by understanding the profitability of different tiers.
- Allows you to prioritise retention on high CLV customers for long term growth.

Typical SaaS businesses often assume a lifespan of 2–5 years depending on the churn rate, so let’s calculate the CLV for the different tiers assuming an average lifespan of 3 years.
For Tallys:
- Basic CLV: £9,445
- Pro CLV: £25,480
- Advanced CLV: £76,628
- Enterprise CLV: £49,8912
Wrapping Up
While the mean can give a general idea of customer spend, it often misrepresents the typical customer in a SaaS model with tiered pricing.
Using alternative methods can provide a clearer picture and help create more effective, data-driven marketing strategies.
Many marketers face the challenge of skewed data. If you have any suggestions on refining this approach, feel free to share in the comments!
